Our Own Electric Company, Part 5
August
(This will be our last post on our solar PV system for a while until we move back home and start using all the appliances outlined in previous posts.)
Once our solar PV system had been fully installed back in July, it took another several weeks for approvals/inspection before we were officially generating electricity off our panels, so Lisa Albrecht dropped by the explain how the process works.

Final tweaks to the DC (white/bottom) and AC (gray/right) disconnects…

… and Rolando says we’re online!
Though we were still several months away from moving back home, now 100% of the electricity being used by the different contractors on-site would be generated by our system. But it really didn’t sink in until I installed the Solar Edge app on my smartphone. In the image above with Rolando, the large white box combines our DC disconnect, inverter, and monitoring gateway. It’s the last of these that allows us to view our system’s electric output (in kilowatt hours… KWh) on a daily, weekly, monthly, quarterly, and yearly basis.
So, below are some screen captures from my phone to show what it looks like.
On November, 14th at around 12:30 PM, our system had generated 10.13 kWh. The graph’s jagged shape reflects the intermittent sun that was able to get through the clouds to the panels on a largely overcast (and later, rainy) day.
Contrast that with September 5th (our highest production day so far) and the smooth bell curve of the chart, which basically means the sun was shining all day without a cloud in the sky. During summer’s longer days, the sun is in the sky for a longer period of time — so the curve will have a wider base while winter curves will be skinnier because the sun is in the sky for a shorter period of time.

Cloudy November 14th around 12:30PM
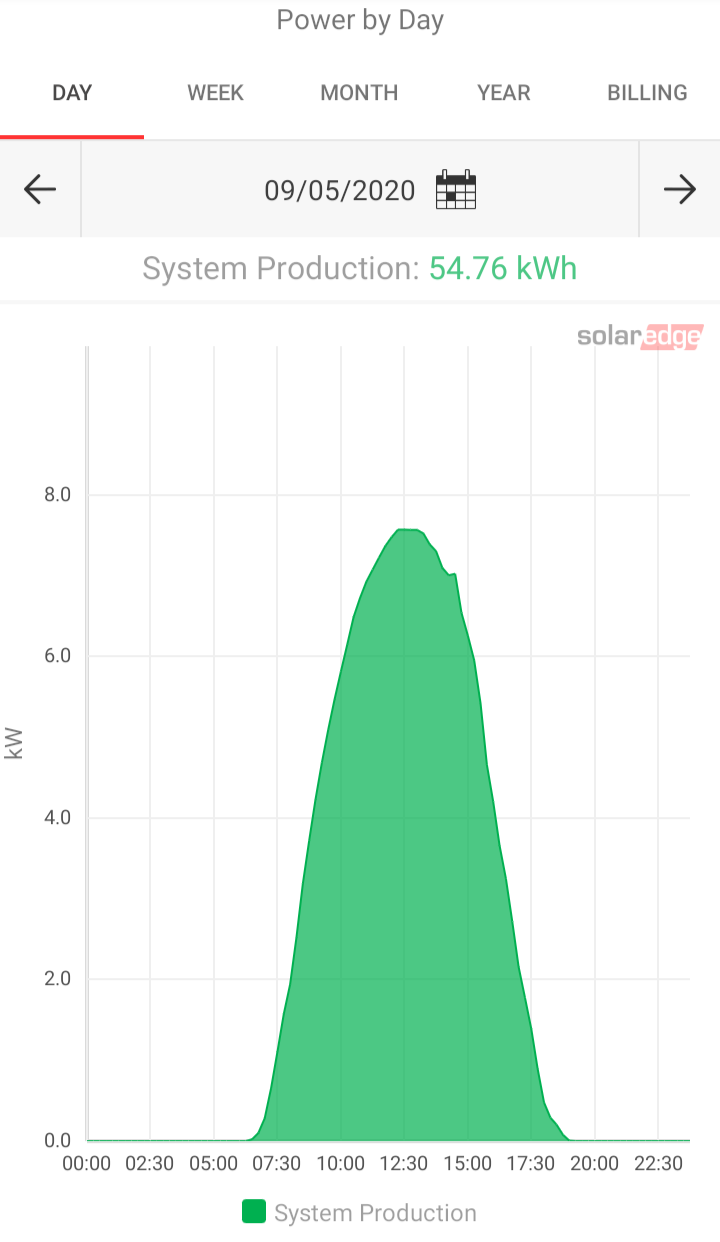
Sunny September 5th
We can also view electricity production by month. Since our system only came online on August 21st, September was our first full month of output. Note the days between the 7th and 11th were most likely rainy/cloudy.
The comparative output is really the “dashboard” we’ll be referring to in order to gauge our system’s overall performance. Lisa Albrecht, our solar designer, had already calculated how much electricity the system is estimated to generate each month (dark green triangles), based upon the design and historic weather conditions. It was pretty encouraging to see that it only took 33% of August’s days for our system to generate nearly 50% of August’s expected output! September exceeded expectations, October fell below expectations, and it looks like November is on-track to exceed output — however, the day I wrote the bulk of this post (Sunday, November 15th) it looks like the familiar Chicago winter weather is well on its way!

Monthly

Comparative output
If you go back to the second post in this series, and take one more look at the long list of the “green column” electric appliances, try to imagine a different set of triangles (pretend they’re blue) superimposed on the Comparative display. Ideally, each blue triangle would fall below each green triangle to indicate we are constantly producing more electricity than we consume. But the reality is that weather will try to make blue jump above green during certain conditions (cloudy, snowy winters; rainy, hotter summers). But our home’s design will try to push that blue down with an air-tight, thermally efficient building envelope so that the five electric minisplits won’t need to turn on as often to heat the home as our former gas-fueled furnace or as often to cool/condition the air in summer as our former air conditioner. We’ll call that the “Battle of the Blue And Green” in coming months…
Stay tuned… we’ll return to our solar PV system with a look at how Net Metering works and how ComEd “pays us back” when we produce more electricity than we consume. And to that last point, be on the lookout for a post about our blower door test coming up soon — the outcome will largely determine our overall energy efficiency!